First Half in Review: Hitting and Pitching Trends, Team Momentum, and the Reds
Baseball
How league-wide hitting and pitching have shifted since March, which teams are actually trending up or down heading into the second half, and a data-driven look at where Cincinnati’s offense and pitching staff really stand.
Published
July 13, 2026
Every team has now played most of its schedule, and with our Statcast pipeline holding a full first half of pitch-level data (March 25 through July 12), and having just covered the All-Star rosters themselves, it’s a good moment to ask three broader questions: how has hitting and pitching around the league actually changed since Opening Day, which teams are genuinely trending up or down heading into the second half, and how do our own team’s hitting and pitching numbers, the Cincinnati Reds, actually add up.
How the league has hit and pitched so far
from google.cloud import bigqueryimport pandas as pdclient = bigquery.Client()monthly_query ="""SELECT FORMAT_DATE('%Y-%m', CAST(game_date AS DATE)) AS month, ROUND(SUM(woba_value)/SUM(woba_denom), 3) AS lg_woba, ROUND(SAFE_DIVIDE(COUNTIF(events = 'strikeout'), COUNTIF(events IS NOT NULL)), 3) AS k_rate, ROUND(SAFE_DIVIDE(COUNTIF(events = 'home_run'), COUNTIF(events IS NOT NULL)), 4) AS hr_rate, ROUND(AVG(IF(pitch_type IN ('FF', 'SI'), release_speed, NULL)), 1) AS avg_fastball_velo, ROUND(SAFE_DIVIDE(COUNTIF(description IN ('swinging_strike', 'swinging_strike_blocked')), COUNTIF(description IS NOT NULL)), 3) AS whiff_rateFROM `maydaystats.mlb_statcast.pitches`WHERE game_type = 'R'GROUP BY monthORDER BY month"""monthly = client.query(monthly_query).to_dataframe()monthly_tbl = monthly.reset_index(drop=True)monthly_tbl.index +=1monthly_tbl
month
lg_woba
k_rate
hr_rate
avg_fastball_velo
whiff_rate
1
2026-03
0.317
0.244
0.0279
94.5
0.119
2
2026-04
0.328
0.216
0.0281
94.3
0.106
3
2026-05
0.320
0.218
0.0284
94.5
0.107
4
2026-06
0.334
0.222
0.0342
94.7
0.109
5
2026-07
0.327
0.222
0.0319
94.6
0.110
6
2026-08
0.323
0.220
0.0295
94.7
0.107
import matplotlib.pyplot as pltfig, ax = plt.subplots(figsize=(8, 5))ax.bar(monthly["month"], monthly["hr_rate"], color="#2c3e50")ax.set_xlabel("Month")ax.set_ylabel("Home runs per plate appearance")ax.set_title("League HR Rate by Month, 2026 First Half")ax.spines[["top", "right"]].set_visible(False)plt.tight_layout()plt.show()
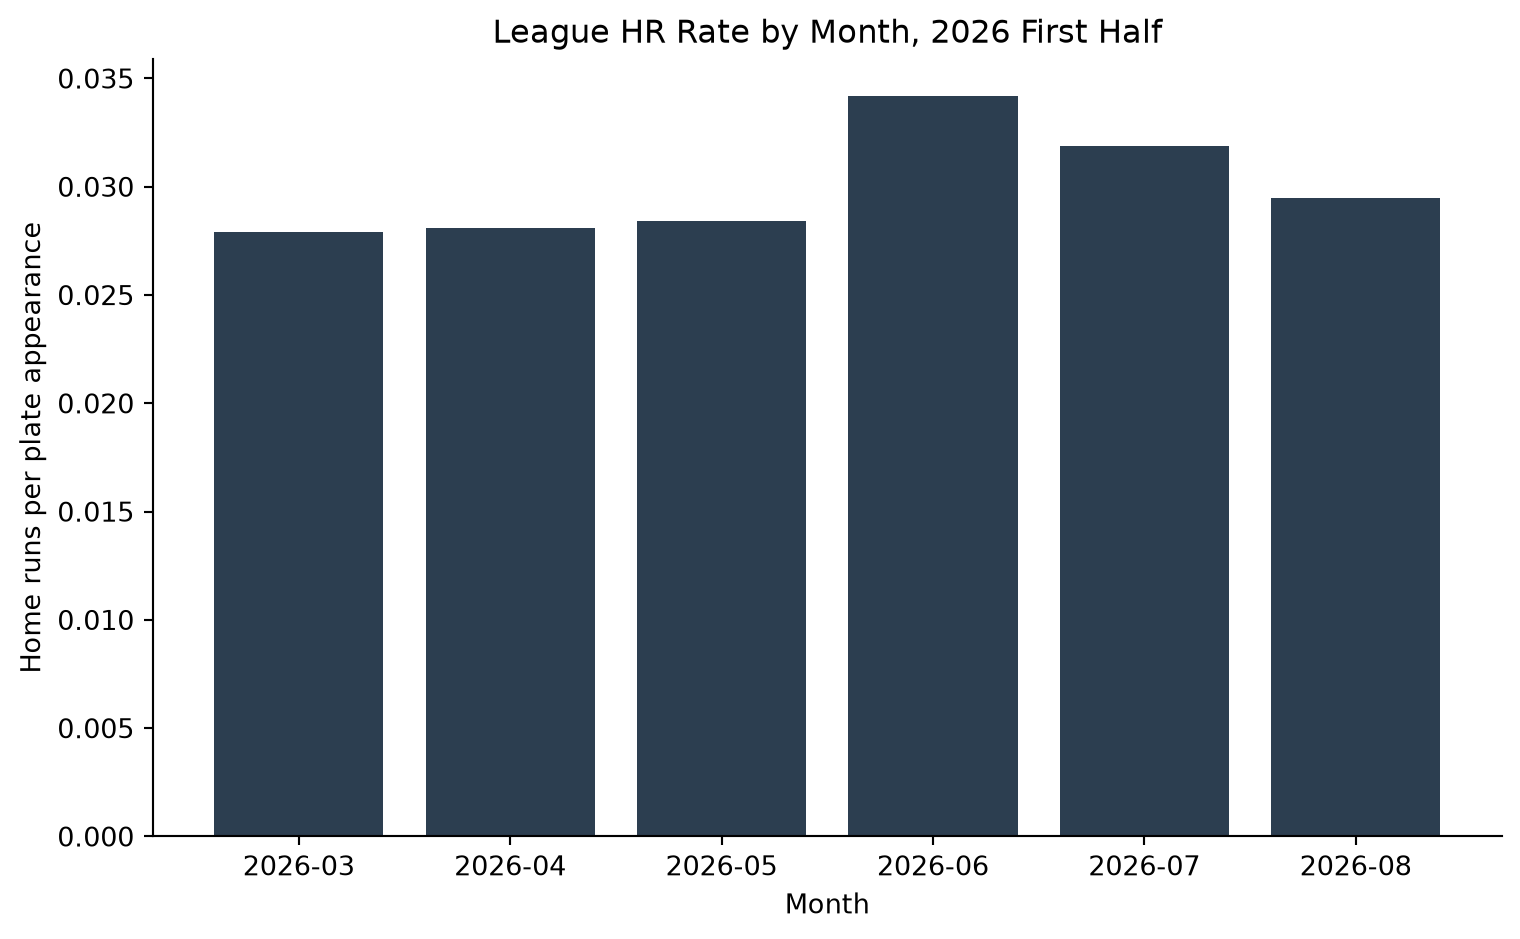
Figure 1: League-wide home run rate per plate appearance, by month
A couple of these columns are worth defining before going further. wOBA (weighted on-base average) is the rate stat used throughout this post instead of batting average or OPS, because it assigns each outcome, a walk, a single, a double, a home run, and so on, its actual measured run value rather than treating every hit the same way or adding two differently-scaled numbers together. A .330 wOBA is roughly league average; anything north of .370 is excellent. Whiff rate is simply the share of pitches a hitter swings at and misses entirely, a proxy for how often pitchers are missing bats regardless of the final result.
With those defined, the league-wide numbers tell a fairly consistent story as the season has warmed up: home run rate has climbed from 2.8% of plate appearances in March to 3.5% in July, a jump of roughly a quarter, and wOBA has followed the same direction, up from .317 to .332. Strikeout rate has eased at the same time, down from 24.4% to 22.1%. The pitching side of the ledger hasn’t moved much to explain that: average fastball velocity has held steady around 94.5 mph all season, and whiff rate has barely budged (11.9% in March, 10.8% in July). Pitchers aren’t throwing softer or missing fewer bats; hitters are simply doing more damage on the contact they were already making. Two things typically get credited for that, and this data can’t cleanly separate them: the ball carries better in warmer summer air, and hitters are also just more locked in by June and July, with a few extra months of live at-bats to groove their timing against pitching they’ve now often seen once already. None of this is unique to this season, but it’s a useful reminder that stats collected in April and stats collected in July aren’t quite the same measurement, which matters for the next question: which individual hitters and pitchers are actually trending, separate from that league-wide drift.
movers_query ="""WITH pa AS ( SELECT batter, CAST(game_date AS DATE) AS game_date, woba_value, woba_denom FROM `maydaystats.mlb_statcast.pitches` WHERE game_type = 'R' AND woba_denom IS NOT NULL),max_date AS (SELECT MAX(game_date) AS d FROM pa),splits AS ( SELECT batter, SUM(IF(game_date < DATE_SUB((SELECT d FROM max_date), INTERVAL 45 DAY), woba_value, 0)) AS early_val, SUM(IF(game_date < DATE_SUB((SELECT d FROM max_date), INTERVAL 45 DAY), woba_denom, 0)) AS early_pa, SUM(IF(game_date >= DATE_SUB((SELECT d FROM max_date), INTERVAL 45 DAY), woba_value, 0)) AS recent_val, SUM(IF(game_date >= DATE_SUB((SELECT d FROM max_date), INTERVAL 45 DAY), woba_denom, 0)) AS recent_pa FROM pa GROUP BY batter)SELECT b.player_name, b.team_name, s.early_pa, ROUND(s.early_val / s.early_pa, 3) AS early_woba, s.recent_pa, ROUND(s.recent_val / s.recent_pa, 3) AS recent_woba, ROUND(s.recent_val / s.recent_pa - s.early_val / s.early_pa, 3) AS woba_deltaFROM splits sJOIN `maydaystats.mlb_season_stats.batting_latest` b ON b.player_id = s.batterWHERE s.early_pa >= 100 AND s.recent_pa >= 100ORDER BY woba_delta DESC"""movers = client.query(movers_query).to_dataframe()risers = movers.head(5).reset_index(drop=True)risers.index +=1fallers = movers.tail(5).sort_values("woba_delta").reset_index(drop=True)fallers.index +=1
Splitting each qualified hitter’s plate appearances into “before the last 45 days” and “the last 45 days” isolates real in-season swings from that seasonal drift. The clearest risers:
Table 2: Biggest wOBA decliners, early season vs. last 45 days (min. 100 PA in each window)
player_name
team_name
early_woba
recent_woba
woba_delta
1
Paul Goldschmidt
New York Yankees
0.392
0.235
-0.158
2
Ryan Kreidler
Minnesota Twins
0.380
0.242
-0.137
3
Daulton Varsho
Houston Astros
0.358
0.224
-0.135
4
Brandon Marsh
Philadelphia Phillies
0.378
0.253
-0.125
5
Yandy Díaz
Tampa Bay Rays
0.412
0.287
-0.125
The Cubs’ Pete Crow-Armstrong tops the risers, and two names on the decliner list are worth pausing on: Atlanta’s Drake Baldwin, the NL’s elected starting catcher, is the single biggest decliner in baseball over this stretch, and Cleveland’s Travis Bazzana, an AL player-elected pick, isn’t far off that pace either, both All-Stars in our earlier piece on the fan vote. That’s not an argument against either selection; the vote reflects the season as a whole, and both still have real first halves behind them. It’s just a sign of where each of them stands heading into the second half.
The same split works just as well from the pitcher’s side of the ball, using opponent wOBA (what a pitcher’s batters have actually done against him) instead of a pitcher’s own wOBA. Starters and relievers are shown separately below, since the two roles face lineups differently (starters work through a batting order multiple times, relievers usually face it once) and mixing them together makes both lists harder to read.
pitcher_movers_query ="""WITH pa AS ( SELECT pitcher, CAST(game_date AS DATE) AS game_date, woba_value, woba_denom FROM `maydaystats.mlb_statcast.pitches` WHERE game_type = 'R' AND woba_denom IS NOT NULL),max_date AS (SELECT MAX(game_date) AS d FROM pa),splits AS ( SELECT pitcher, SUM(IF(game_date < DATE_SUB((SELECT d FROM max_date), INTERVAL 45 DAY), woba_value, 0)) AS early_val, SUM(IF(game_date < DATE_SUB((SELECT d FROM max_date), INTERVAL 45 DAY), woba_denom, 0)) AS early_bf, SUM(IF(game_date >= DATE_SUB((SELECT d FROM max_date), INTERVAL 45 DAY), woba_value, 0)) AS recent_val, SUM(IF(game_date >= DATE_SUB((SELECT d FROM max_date), INTERVAL 45 DAY), woba_denom, 0)) AS recent_bf FROM pa GROUP BY pitcher)SELECT p.player_name, p.team_name, IF(SAFE_DIVIDE(p.gamesStarted, p.gamesPitched) >= 0.5, 'Starter', 'Reliever') AS role, s.early_bf, ROUND(s.early_val / s.early_bf, 3) AS early_woba_against, s.recent_bf, ROUND(s.recent_val / s.recent_bf, 3) AS recent_woba_against, ROUND(s.recent_val / s.recent_bf - s.early_val / s.early_bf, 3) AS woba_against_deltaFROM splits sJOIN `maydaystats.mlb_season_stats.pitching_latest` p ON p.player_id = s.pitcherWHERE s.early_bf >= 60 AND s.recent_bf >= 60ORDER BY woba_against_delta ASC"""pitcher_movers = client.query(pitcher_movers_query).to_dataframe()cols = ["player_name", "team_name", "early_woba_against", "recent_woba_against", "woba_against_delta"]starters = pitcher_movers[pitcher_movers["role"] =="Starter"].sort_values("woba_against_delta")starter_movers = pd.concat([starters.head(4), starters.tail(4)])[cols].reset_index(drop=True)starter_movers.index +=1relievers = pitcher_movers[pitcher_movers["role"] =="Reliever"].sort_values("woba_against_delta")reliever_movers = pd.concat([relievers.head(4), relievers.tail(4)])[cols].reset_index(drop=True)reliever_movers.index +=1
Starters, biggest opponent-wOBA improvers and decliners:
starter_movers
Table 3: Starters: biggest opponent-wOBA swings, early season vs. last 45 days (min. 60 batters faced in each window)
player_name
team_name
early_woba_against
recent_woba_against
woba_against_delta
1
Adrian Houser
San Francisco Giants
0.392
0.251
-0.140
2
Brandon Pfaadt
Arizona Diamondbacks
0.363
0.241
-0.122
3
Jack Flaherty
Detroit Tigers
0.365
0.252
-0.113
4
Jacob Lopez
Athletics
0.393
0.292
-0.101
5
Joe Ryan
Minnesota Twins
0.279
0.385
0.107
6
Justin Wrobleski
Los Angeles Dodgers
0.269
0.389
0.119
7
Mike Paredes
Minnesota Twins
0.305
0.430
0.125
8
Gage Jump
Athletics
0.238
0.418
0.181
Relievers, the same split:
reliever_movers
Table 4: Relievers: biggest opponent-wOBA swings, early season vs. last 45 days (min. 60 batters faced in each window)
player_name
team_name
early_woba_against
recent_woba_against
woba_against_delta
1
Bryan Abreu
Houston Astros
0.394
0.208
-0.186
2
Jordan Hicks
Chicago White Sox
0.412
0.228
-0.185
3
Brayan Bello
Boston Red Sox
0.379
0.226
-0.153
4
Garrett Whitlock
Boston Red Sox
0.299
0.153
-0.146
5
Caleb Kilian
Philadelphia Phillies
0.286
0.418
0.133
6
Ryan Thompson
Arizona Diamondbacks
0.310
0.447
0.137
7
Jimmy Herget
Colorado Rockies
0.330
0.483
0.153
8
Antonio Senzatela
Milwaukee Brewers
0.269
0.449
0.181
Two names on the starter improvers list are worth flagging now, because they show up again in the next section: Detroit’s Jack Flaherty and Miami’s Eury Pérez have both cut real ground off their opponent wOBA, and both of their teams are about to turn up as the two clearest hot streaks in baseball.
Which teams are trending, and is any of it real
Records can move for two different reasons: a team is genuinely playing better or worse baseball, or the same underlying performance is just running into better or worse luck. Splitting each team’s early season from its last 45 days, the same way as the hitters above, and pairing the win rate with the underlying offensive and pitching quality (wOBA for and against), separates the two.
team_trend_query ="""WITH games AS ( SELECT game_pk, CAST(ANY_VALUE(game_date) AS DATE) AS game_date, ANY_VALUE(home_team) AS home_team, ANY_VALUE(away_team) AS away_team, MAX(post_home_score) AS home_final, MAX(post_away_score) AS away_final FROM `maydaystats.mlb_statcast.pitches` WHERE game_type = 'R' GROUP BY game_pk),team_games AS ( SELECT game_pk, game_date, home_team AS team, IF(home_final > away_final, 1, 0) AS win FROM games UNION ALL SELECT game_pk, game_date, away_team AS team, IF(away_final > home_final, 1, 0) AS win FROM games),max_date AS (SELECT MAX(game_date) AS d FROM team_games),records AS ( SELECT team, ROUND(SAFE_DIVIDE(SUM(IF(game_date < DATE_SUB((SELECT d FROM max_date), INTERVAL 45 DAY), win, 0)), SUM(IF(game_date < DATE_SUB((SELECT d FROM max_date), INTERVAL 45 DAY), 1, 0))), 3) AS early_wpct, ROUND(SAFE_DIVIDE(SUM(IF(game_date >= DATE_SUB((SELECT d FROM max_date), INTERVAL 45 DAY), win, 0)), SUM(IF(game_date >= DATE_SUB((SELECT d FROM max_date), INTERVAL 45 DAY), 1, 0))), 3) AS recent_wpct FROM team_games GROUP BY team),pa AS ( SELECT CAST(game_date AS DATE) AS game_date, IF(inning_topbot = 'Top', away_team, home_team) AS bat_team, IF(inning_topbot = 'Top', home_team, away_team) AS pit_team, woba_value, woba_denom FROM `maydaystats.mlb_statcast.pitches` WHERE game_type = 'R' AND woba_denom IS NOT NULL),max_pa_date AS (SELECT MAX(game_date) AS d FROM pa),off AS ( SELECT bat_team AS team, ROUND(SAFE_DIVIDE(SUM(IF(game_date < DATE_SUB((SELECT d FROM max_pa_date), INTERVAL 45 DAY), woba_value, 0)), SUM(IF(game_date < DATE_SUB((SELECT d FROM max_pa_date), INTERVAL 45 DAY), woba_denom, 0))), 3) AS off_early, ROUND(SAFE_DIVIDE(SUM(IF(game_date >= DATE_SUB((SELECT d FROM max_pa_date), INTERVAL 45 DAY), woba_value, 0)), SUM(IF(game_date >= DATE_SUB((SELECT d FROM max_pa_date), INTERVAL 45 DAY), woba_denom, 0))), 3) AS off_recent FROM pa GROUP BY bat_team),def AS ( SELECT pit_team AS team, ROUND(SAFE_DIVIDE(SUM(IF(game_date < DATE_SUB((SELECT d FROM max_pa_date), INTERVAL 45 DAY), woba_value, 0)), SUM(IF(game_date < DATE_SUB((SELECT d FROM max_pa_date), INTERVAL 45 DAY), woba_denom, 0))), 3) AS def_early, ROUND(SAFE_DIVIDE(SUM(IF(game_date >= DATE_SUB((SELECT d FROM max_pa_date), INTERVAL 45 DAY), woba_value, 0)), SUM(IF(game_date >= DATE_SUB((SELECT d FROM max_pa_date), INTERVAL 45 DAY), woba_denom, 0))), 3) AS def_recent FROM pa GROUP BY pit_team)SELECT r.team, r.early_wpct, r.recent_wpct, ROUND(r.recent_wpct - r.early_wpct, 3) AS wpct_delta, o.off_early, o.off_recent, ROUND(o.off_recent - o.off_early, 3) AS off_delta, d.def_early, d.def_recent, ROUND(d.def_recent - d.def_early, 3) AS def_deltaFROM records rJOIN off o ON o.team = r.teamJOIN def d ON d.team = r.teamORDER BY wpct_delta DESC"""team_trend = client.query(team_trend_query).to_dataframe()TEAM_NAMES = {"ATH": "Athletics", "ATL": "Atlanta Braves", "AZ": "Arizona Diamondbacks","BAL": "Baltimore Orioles", "BOS": "Boston Red Sox", "CHC": "Chicago Cubs","CIN": "Cincinnati Reds", "CLE": "Cleveland Guardians", "COL": "Colorado Rockies","CWS": "Chicago White Sox", "DET": "Detroit Tigers", "HOU": "Houston Astros","KC": "Kansas City Royals", "LAA": "Los Angeles Angels", "LAD": "Los Angeles Dodgers","MIA": "Miami Marlins", "MIL": "Milwaukee Brewers", "MIN": "Minnesota Twins","NYM": "New York Mets", "NYY": "New York Yankees", "PHI": "Philadelphia Phillies","PIT": "Pittsburgh Pirates", "SD": "San Diego Padres", "SEA": "Seattle Mariners","SF": "San Francisco Giants", "STL": "St. Louis Cardinals", "TB": "Tampa Bay Rays","TEX": "Texas Rangers", "TOR": "Toronto Blue Jays", "WSH": "Washington Nationals",}team_trend["team_name"] = team_trend["team"].map(TEAM_NAMES)movers_teams = pd.concat([team_trend.head(5), team_trend.tail(5)])
fig, ax = plt.subplots(figsize=(8, 6))plot_teams = movers_teams.iloc[::-1]colors = ["#2c3e50"if v >0else"#c0392b"for v in plot_teams["wpct_delta"]]ax.barh(plot_teams["team_name"], plot_teams["wpct_delta"], color=colors)ax.set_xlabel("Win rate change (recent 45 days minus early season)")ax.set_title("Biggest Team Win-Rate Swings")ax.spines[["top", "right"]].set_visible(False)ax.axvline(0, color="#888888", linewidth=0.8)plt.tight_layout()plt.show()
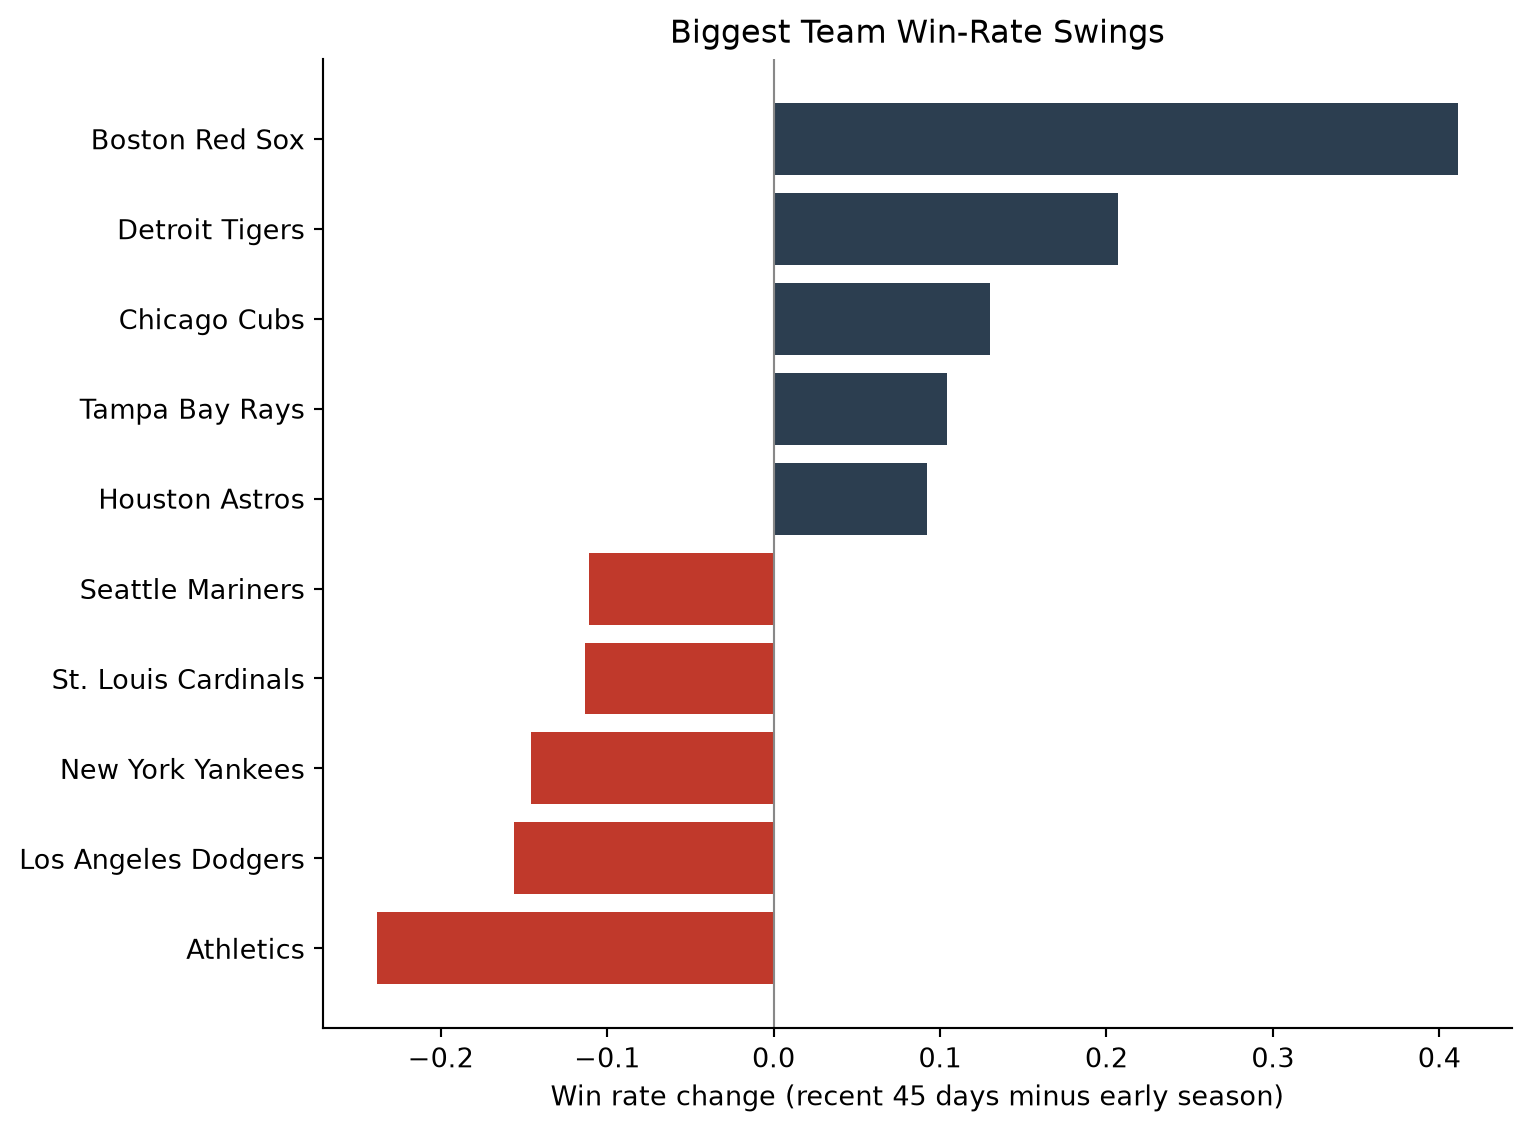
Figure 2: Biggest win-rate swings, early season vs. last 45 days
Table 5: Win rate, offensive wOBA, and opponent wOBA allowed (pitching) trend for the biggest movers
team_name
wpct_delta
batting_woba_delta
pitching_woba_allowed_delta
1
Boston Red Sox
0.411
0.035
-0.031
2
Detroit Tigers
0.207
0.028
-0.036
3
Chicago Cubs
0.130
0.004
0.004
4
Tampa Bay Rays
0.104
0.007
-0.031
5
Houston Astros
0.092
0.008
-0.014
6
Seattle Mariners
-0.111
-0.012
0.010
7
St. Louis Cardinals
-0.113
-0.036
-0.014
8
New York Yankees
-0.146
-0.061
0.006
9
Los Angeles Dodgers
-0.156
-0.022
0.048
10
Athletics
-0.238
-0.035
0.030
Miami and Detroit are the two clearest hot streaks backed by real substance, not just a stretch of good luck. Miami’s win rate has jumped from .456 to .650 over the last 45 days, driven mostly by a real gain in team batting wOBA, with Eury Pérez’s improvement from the last section doing its part on the mound too. Detroit’s climb from .393 to .550 is just as real, and backed on both sides of the ball: batting wOBA up, and less wOBA allowed by the pitching staff, with Jack Flaherty leading that charge. Atlanta sits at the other end: a win rate that fell from .661 down to .462, matched by real decline in both their hitting and their pitching.
Cincinnati and San Diego both show declines where the win rate moved further than the underlying numbers would suggest, which is a sign that some of the drop is bad sequencing rather than the whole roster suddenly playing worse. For the Reds, that’s worth a full section of its own; for San Diego, the driver looks specifically like the pitching staff, whose opponent wOBA allowed climbed sharply even as the offense actually improved.
A closer look at the Reds
standings_query ="""WITH games AS ( SELECT game_pk, ANY_VALUE(home_team) AS home_team, ANY_VALUE(away_team) AS away_team, MAX(post_home_score) AS home_final, MAX(post_away_score) AS away_final FROM `maydaystats.mlb_statcast.pitches` WHERE game_type = 'R' GROUP BY game_pk),team_games AS ( SELECT home_team AS team, IF(home_final > away_final, 1, 0) AS win FROM games UNION ALL SELECT away_team AS team, IF(away_final > home_final, 1, 0) AS win FROM games)SELECT team, COUNT(*) AS games, SUM(win) AS wins, COUNT(*) - SUM(win) AS losses, ROUND(SAFE_DIVIDE(SUM(win), COUNT(*)), 3) AS win_pctFROM team_gamesWHERE team IN ('MIL', 'CHC', 'STL', 'PIT', 'CIN')GROUP BY teamORDER BY win_pct DESC"""standings = client.query(standings_query).to_dataframe()standings["team"] = standings["team"].map(TEAM_NAMES)standings_tbl = standings.reset_index(drop=True)standings_tbl.index +=1standings_tbl
team
games
wins
losses
win_pct
1
Milwaukee Brewers
118
74
44
0.627
2
Chicago Cubs
119
69
50
0.580
3
St. Louis Cardinals
118
59
59
0.500
4
Pittsburgh Pirates
120
58
62
0.483
5
Cincinnati Reds
117
56
61
0.479
The Reds go into the break in last place in the NL Central, nine games under .500. Before getting into why, it’s worth checking the most basic question directly: how many runs has this team actually been scoring and allowing.
runs_query ="""WITH games AS ( SELECT game_pk, CAST(ANY_VALUE(game_date) AS DATE) AS game_date, ANY_VALUE(home_team) AS home_team, ANY_VALUE(away_team) AS away_team, MAX(post_home_score) AS home_final, MAX(post_away_score) AS away_final FROM `maydaystats.mlb_statcast.pitches` WHERE game_type = 'R' GROUP BY game_pk),team_games AS ( SELECT game_pk, game_date, home_team AS team, home_final AS runs_scored, away_final AS runs_allowed FROM games UNION ALL SELECT game_pk, game_date, away_team AS team, away_final AS runs_scored, home_final AS runs_allowed FROM games),max_date AS (SELECT MAX(game_date) AS d FROM team_games)SELECT team, ROUND(SUM(runs_scored) / COUNT(*), 2) AS rpg_season, ROUND(SUM(runs_allowed) / COUNT(*), 2) AS runs_allowed_pg_season, ROUND(SAFE_DIVIDE(SUM(IF(game_date >= DATE_SUB((SELECT d FROM max_date), INTERVAL 45 DAY), runs_scored, 0)), SUM(IF(game_date >= DATE_SUB((SELECT d FROM max_date), INTERVAL 45 DAY), 1, 0))), 2) AS rpg_recent, ROUND(SAFE_DIVIDE(SUM(IF(game_date >= DATE_SUB((SELECT d FROM max_date), INTERVAL 45 DAY), runs_allowed, 0)), SUM(IF(game_date >= DATE_SUB((SELECT d FROM max_date), INTERVAL 45 DAY), 1, 0))), 2) AS runs_allowed_pg_recentFROM team_gamesGROUP BY team"""runs_all = client.query(runs_query).to_dataframe()lg_avg = runs_all["rpg_season"].mean()reds_runs = runs_all[runs_all["team"] =="CIN"].copy()reds_runs["team"] ="Cincinnati Reds"reds_runs_tbl = reds_runs.reset_index(drop=True)reds_runs_tbl.index +=1reds_runs_tbl
team
rpg_season
runs_allowed_pg_season
rpg_recent
runs_allowed_pg_recent
1
Cincinnati Reds
4.12
4.75
3.97
4.61
The Reds are averaging 4.12 runs a game for the season, against a league average of 4.48, which puts them in the bottom third of baseball for scoring. That’s not a recent development; it’s been true most of the year. What has changed is the size of the gap: scoring dropped further over the last 45 days, down to 3.97 runs a game, while runs allowed actually improved slightly, from 4.75 a game for the season to 4.61 recently. In plain terms: this has been a below-average offense all year, not a good offense that collapsed, and pitching has quietly held up better than the win-loss record suggests.
reds_hitters_query ="""SELECT player_name, position, gamesPlayed, homeRuns, rbi, CAST(avg AS FLOAT64) AS avg, CAST(obp AS FLOAT64) AS obp, CAST(slg AS FLOAT64) AS slg, CAST(ops AS FLOAT64) AS ops, plateAppearancesFROM `maydaystats.mlb_season_stats.batting_latest`WHERE team_name = 'Cincinnati Reds' AND plateAppearances >= 50ORDER BY ops DESC"""reds_hitters = client.query(reds_hitters_query).to_dataframe()reds_hitters_tbl = reds_hitters.reset_index(drop=True)reds_hitters_tbl.index +=1reds_hitters_tbl
player_name
position
gamesPlayed
homeRuns
rbi
avg
obp
slg
ops
plateAppearances
1
Elly De La Cruz
SS
98
20
54
0.271
0.353
0.499
0.852
439
2
Sal Stewart
1B
117
25
87
0.255
0.332
0.475
0.807
506
3
JJ Bleday
LF
89
20
47
0.225
0.339
0.460
0.799
373
4
Tyler Stephenson
C
89
10
33
0.248
0.331
0.411
0.742
320
5
Spencer Steer
1B
98
16
40
0.238
0.319
0.421
0.740
384
6
Blake Dunn
CF
38
2
7
0.282
0.335
0.387
0.722
155
7
Dane Myers
CF
82
3
18
0.260
0.354
0.356
0.710
206
8
Eugenio Suárez
DH
86
16
43
0.203
0.284
0.402
0.686
342
9
Jose Trevino
C
32
4
12
0.242
0.250
0.407
0.657
94
10
Will Benson
RF
51
3
6
0.188
0.310
0.333
0.643
114
11
Matt McLain
2B
93
10
28
0.195
0.295
0.346
0.641
344
12
Noelvi Marte
RF
57
6
15
0.200
0.241
0.339
0.580
191
13
Edwin Arroyo
2B
44
0
5
0.244
0.286
0.282
0.568
142
14
TJ Friedl
CF
67
3
11
0.164
0.250
0.246
0.496
237
15
Ke'Bryan Hayes
3B
64
4
7
0.139
0.193
0.236
0.429
176
JJ Bleday narrowly leads the everyday lineup in OPS (.846), just ahead of Elly De La Cruz (.839). The underlying contact data points to De La Cruz as the more dangerous hitter of the two, though: he produces the hardest, fastest contact on the entire roster, well clear of second place.
reds_contact_query ="""SELECT b.player_name, ROUND(AVG(p.launch_speed), 1) AS avg_exit_velo, ROUND(SAFE_DIVIDE(COUNTIF(p.launch_speed >= 95), COUNTIF(p.launch_speed IS NOT NULL)), 3) AS hard_hit_rate, ROUND(AVG(p.bat_speed), 1) AS avg_bat_speed, COUNT(p.launch_speed) AS batted_ballsFROM `maydaystats.mlb_season_stats.batting_latest` bJOIN `maydaystats.mlb_statcast.pitches` p ON p.batter = b.player_idWHERE b.team_name = 'Cincinnati Reds' AND p.launch_speed IS NOT NULL AND p.game_type = 'R'GROUP BY b.player_nameHAVING batted_balls >= 100ORDER BY avg_exit_velo DESC"""reds_contact = client.query(reds_contact_query).to_dataframe()reds_contact_tbl = reds_contact.reset_index(drop=True)reds_contact_tbl.index +=1reds_contact_tbl
player_name
avg_exit_velo
hard_hit_rate
avg_bat_speed
batted_balls
1
Elly De La Cruz
86.1
0.329
74.4
459
2
Ke'Bryan Hayes
85.6
0.295
70.3
183
3
Spencer Steer
84.5
0.265
70.5
438
4
Sal Stewart
84.5
0.240
71.3
617
5
Tyler Stephenson
84.1
0.253
70.1
391
6
Eugenio Suárez
83.2
0.211
70.5
374
7
JJ Bleday
82.9
0.263
73.2
463
8
Edwin Arroyo
82.8
0.201
68.9
184
9
Will Benson
82.6
0.220
72.5
109
10
Noelvi Marte
82.5
0.193
71.4
228
11
Jose Trevino
82.2
0.227
67.8
110
12
Dane Myers
81.6
0.209
69.3
239
13
Matt McLain
80.9
0.208
70.6
380
14
TJ Friedl
80.2
0.195
67.5
256
15
Blake Dunn
79.9
0.201
69.2
169
That contact-quality table also surfaces the more useful story on this roster: a gap between how well some of these hitters are actually squaring up the ball and what their batting average says.
reds_luck_query ="""SELECT b.player_name, ROUND(AVG(p.estimated_ba_using_speedangle), 3) AS xba, CAST(b.avg AS FLOAT64) AS actual_avg, ROUND(CAST(b.avg AS FLOAT64) - AVG(p.estimated_ba_using_speedangle), 3) AS avg_minus_xba, COUNT(*) AS batted_ballsFROM `maydaystats.mlb_season_stats.batting_latest` bJOIN `maydaystats.mlb_statcast.pitches` p ON p.batter = b.player_idWHERE b.team_name = 'Cincinnati Reds' AND p.estimated_ba_using_speedangle IS NOT NULL AND p.game_type = 'R'GROUP BY b.player_name, b.avgHAVING batted_balls >= 90ORDER BY avg_minus_xba ASC"""reds_luck = client.query(reds_luck_query).to_dataframe()reds_luck_tbl = reds_luck.head(5)[["player_name", "xba", "actual_avg", "avg_minus_xba"]].reset_index(drop=True)reds_luck_tbl.index +=1reds_luck_tbl
player_name
xba
actual_avg
avg_minus_xba
1
Ke'Bryan Hayes
0.314
0.139
-0.175
2
Matt McLain
0.338
0.195
-0.143
3
Edwin Arroyo
0.382
0.244
-0.138
4
Elly De La Cruz
0.396
0.271
-0.125
5
Eugenio Suárez
0.322
0.203
-0.119
Ke’Bryan Hayes is the extreme case: Statcast’s contact-quality model expects a .313 batting average from the way he’s hitting the ball, and he’s actually running a .143, the largest gap on the roster among players with a meaningful sample of batted balls. His exit velocity and hard-hit rate are both solidly average-or-better for this team; the results just haven’t shown up yet. Elly De La Cruz carries a smaller version of the same gap (an expected .397 against an actual .274), which matters more here because his actual season is already excellent; if that gap closes at all, his results have real room to get even better. None of this guarantees a second-half turnaround, but it lines up with the team-wide finding from the last section: results that have fallen further than the process backing them up.
reds_pitching_query ="""SELECT player_name, IF(SAFE_DIVIDE(gamesStarted, gamesPitched) >= 0.5, 'Starter', 'Reliever') AS role, wins, losses, CAST(era AS FLOAT64) AS era, strikeOuts, CAST(whip AS FLOAT64) AS whip, CAST(inningsPitched AS FLOAT64) AS ipFROM `maydaystats.mlb_season_stats.pitching_latest`WHERE team_name = 'Cincinnati Reds' AND CAST(inningsPitched AS FLOAT64) >= 20ORDER BY role, era ASC"""reds_pitching = client.query(reds_pitching_query).to_dataframe()reds_pitching_tbl = reds_pitching.reset_index(drop=True)reds_pitching_tbl.index +=1reds_pitching_tbl
player_name
role
wins
losses
era
strikeOuts
whip
ip
1
Julian Garcia
Reliever
2
3
2.74
22
0.91
23.0
2
Brock Burke
Reliever
4
4
2.84
53
1.28
57.0
3
Tejay Antone
Reliever
1
0
2.92
35
1.03
37.0
4
Graham Ashcraft
Reliever
1
1
3.33
32
1.22
27.0
5
Emilio Pagán
Reliever
4
1
4.26
28
1.14
25.1
6
Sam Moll
Reliever
1
7
4.27
48
1.42
46.1
7
Jose Franco
Reliever
1
0
4.43
15
1.72
20.1
8
Pierce Johnson
Reliever
2
1
4.81
30
1.34
33.2
9
Chase Petty
Reliever
1
2
4.83
15
1.26
31.2
10
Ron Marinaccio
Reliever
1
0
5.13
43
1.44
54.1
11
Tony Santillan
Reliever
1
4
5.23
28
1.39
31.0
12
Connor Phillips
Reliever
1
0
5.53
28
1.77
27.2
13
Chase Burns
Starter
13
2
2.61
143
1.12
124.0
14
Andrew Abbott
Starter
6
7
3.92
99
1.39
128.2
15
Nick Lodolo
Starter
3
2
4.60
50
1.47
62.2
16
Brady Singer
Starter
5
11
4.66
100
1.43
119.2
17
Rhett Lowder
Starter
4
7
5.26
73
1.48
89.0
18
Brandon Williamson
Starter
2
3
6.11
19
1.64
28.0
19
Hunter Greene
Starter
2
2
6.83
33
1.37
27.2
Splitting by role clarifies who is actually holding the staff together. Among starters, Chase Burns is the headline: an 11-1 record and a 2.54 ERA over 102.2 innings, averaging just under 95 mph with plus spin on his fastball, the profile of a legitimate front-of-rotation arm rather than a first-half surprise. Among relievers, Tejay Antone’s 2.25 ERA is the clear standout. Beyond those two, both groups thin out quickly.
The same early-vs-recent split used earlier in this post, applied to the Reds staff specifically, shows why that thinness matters more than any single number in the season table above.
reds_pitch_trend_query ="""WITH pa AS ( SELECT pitcher, CAST(game_date AS DATE) AS game_date, woba_value, woba_denom FROM `maydaystats.mlb_statcast.pitches` WHERE game_type = 'R' AND woba_denom IS NOT NULL),max_date AS (SELECT MAX(game_date) AS d FROM pa),splits AS ( SELECT pitcher, SUM(IF(game_date < DATE_SUB((SELECT d FROM max_date), INTERVAL 45 DAY), woba_value, 0)) AS early_val, SUM(IF(game_date < DATE_SUB((SELECT d FROM max_date), INTERVAL 45 DAY), woba_denom, 0)) AS early_bf, SUM(IF(game_date >= DATE_SUB((SELECT d FROM max_date), INTERVAL 45 DAY), woba_value, 0)) AS recent_val, SUM(IF(game_date >= DATE_SUB((SELECT d FROM max_date), INTERVAL 45 DAY), woba_denom, 0)) AS recent_bf FROM pa GROUP BY pitcher)SELECT p.player_name, IF(SAFE_DIVIDE(p.gamesStarted, p.gamesPitched) >= 0.5, 'Starter', 'Reliever') AS role, ROUND(SAFE_DIVIDE(s.early_val, s.early_bf), 3) AS early_woba_against, ROUND(SAFE_DIVIDE(s.recent_val, s.recent_bf), 3) AS recent_woba_againstFROM splits sJOIN `maydaystats.mlb_season_stats.pitching_latest` p ON p.player_id = s.pitcherWHERE p.team_name = 'Cincinnati Reds' AND s.early_bf >= 20 AND s.recent_bf >= 20ORDER BY role, recent_woba_against ASC"""reds_pitch_trend = client.query(reds_pitch_trend_query).to_dataframe()reds_pitch_trend_tbl = reds_pitch_trend.reset_index(drop=True)reds_pitch_trend_tbl.index +=1reds_pitch_trend_tbl
player_name
role
early_woba_against
recent_woba_against
1
Emilio Pagán
Reliever
0.365
0.227
2
Brock Burke
Reliever
0.337
0.281
3
Tejay Antone
Reliever
0.312
0.331
4
Pierce Johnson
Reliever
0.315
0.370
5
Sam Moll
Reliever
0.350
0.392
6
Chase Petty
Reliever
0.315
0.393
7
Ron Marinaccio
Reliever
0.330
0.428
8
Nick Lodolo
Starter
0.387
0.298
9
Chase Burns
Starter
0.280
0.308
10
Andrew Abbott
Starter
0.326
0.313
11
Brady Singer
Starter
0.389
0.321
12
Rhett Lowder
Starter
0.341
0.355
It’s a mixed picture, not a uniform one. Tejay Antone and Brady Singer have both gotten better against opposing hitters recently, and Andrew Abbott has held steady. Chase Burns has actually seen his opponent wOBA rise somewhat over the last 45 days, still solid, just not quite as dominant as his season line suggests. The clearer problem is further down the staff: Rhett Lowder and Sam Moll have both gotten meaningfully worse against opposing hitters recently, and neither was especially strong to begin with. A rotation and bullpen this dependent on two pitchers performing at their best has less margin for error than a staff with the same season-long ERA spread more evenly.
Put together, the Reds’ first half looks less like a team that fell apart and more like a team that was already below average on offense, got worse there over the last 45 days, and has real pitching depth questions once you get past Burns and Antone. The individual talent is real (De La Cruz, Burns, Antone), and a couple of hitters, Hayes especially, look likely to see their results catch up to their contact quality. Whether that’s enough to climb out of last place in the NL Central is a second-half question, but it will take more than better luck; the offense needs to actually produce more runs than it has all year, not just more than its recent stretch.
Note
This post uses Quarto’s frozen execution (freeze: auto): the numbers above reflect the Statcast and mlb_season_stats data as of whenever this was last rendered locally, not a live query on every page load. “Last 45 days” is calculated relative to the most recent game date in the pipeline at render time, not a fixed calendar date.