Contact Quality Has Been Falling Since Spring, and Whiffs Aren’t the Reason
Baseball
Hard-hit rate and exit velocity have declined for months running, home run rate and wOBA cooled off after peaking in June, and whiff rate hasn’t moved at all, a league-wide Statcast trend check through early August.
Published
August 11, 2026
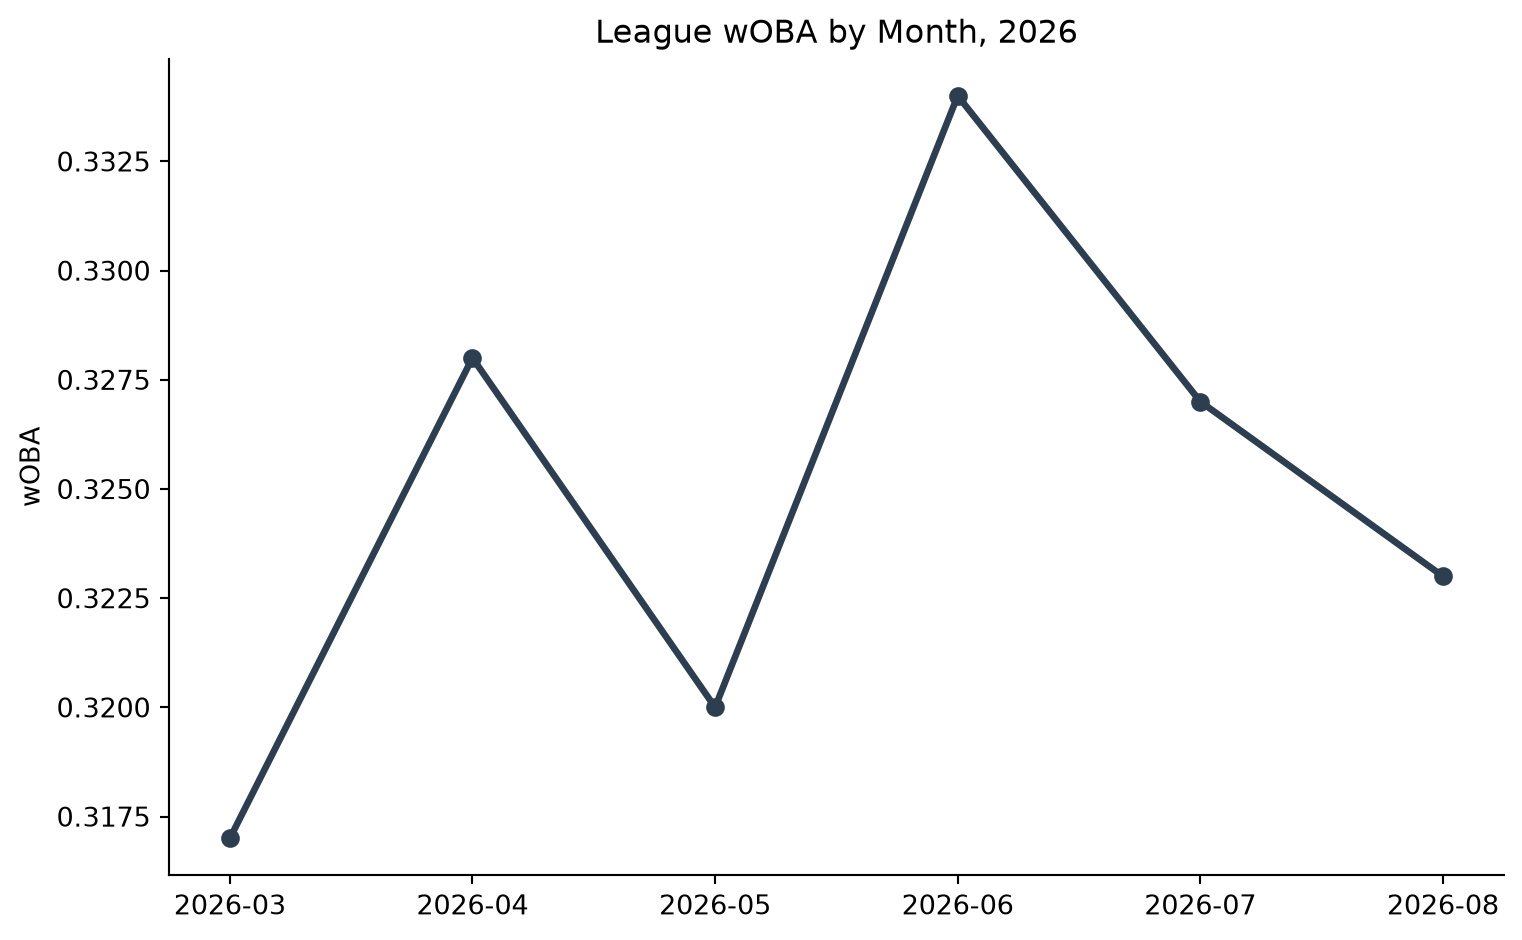
Our first-half review post noted league-wide wOBA climbing from .317 in March to .334 by June, and credited warmer air and hitters getting more reps as the season went on. A month of additional data changes that story in a specific way: the offensive climb already peaked in June, contact quality itself had already started slipping before that, and the two trends didn’t move together the way you’d expect.
The season, month by month
from google.cloud import bigqueryclient = bigquery.Client()monthly_query ="""SELECT FORMAT_DATE('%Y-%m', CAST(game_date AS DATE)) AS month, COUNT(DISTINCT game_pk) AS games, ROUND(SAFE_DIVIDE(SUM(woba_value), SUM(woba_denom)), 3) AS lg_woba, ROUND(SAFE_DIVIDE(COUNTIF(events = 'strikeout'), COUNTIF(events IS NOT NULL)), 3) AS k_rate, ROUND(SAFE_DIVIDE(COUNTIF(events = 'walk'), COUNTIF(events IS NOT NULL)), 3) AS bb_rate, ROUND(SAFE_DIVIDE(COUNTIF(events = 'home_run'), COUNTIF(events IS NOT NULL)), 4) AS hr_rate, ROUND(SAFE_DIVIDE(COUNTIF(description IN ('swinging_strike', 'swinging_strike_blocked')), COUNTIF(description IS NOT NULL)), 3) AS whiff_rate, ROUND(AVG(launch_speed), 2) AS avg_exit_velo, ROUND(SAFE_DIVIDE(COUNTIF(launch_speed >= 95), COUNTIF(launch_speed IS NOT NULL)), 3) AS hard_hit_rate, ROUND(AVG(IF(pitch_type IN ('FF', 'SI'), release_speed, NULL)), 2) AS avg_fastball_veloFROM `maydaystats.mlb_statcast.pitches`WHERE game_type = 'R'GROUP BY monthORDER BY month"""monthly = client.query(monthly_query).to_dataframe()monthly_tbl = monthly.reset_index(drop=True)monthly_tbl.index +=1monthly_tbl
month
games
lg_woba
k_rate
bb_rate
hr_rate
whiff_rate
avg_exit_velo
hard_hit_rate
avg_fastball_velo
1
2026-03
76
0.317
0.244
0.095
0.0279
0.119
82.67
0.247
94.49
2
2026-04
392
0.328
0.216
0.092
0.0281
0.106
82.67
0.249
94.29
3
2026-05
419
0.320
0.218
0.085
0.0284
0.107
82.77
0.244
94.50
4
2026-06
394
0.334
0.222
0.083
0.0342
0.109
82.51
0.240
94.69
5
2026-07
371
0.327
0.222
0.082
0.0319
0.110
82.47
0.235
94.64
6
2026-08
124
0.323
0.220
0.088
0.0295
0.107
82.35
0.229
94.66
import matplotlib.pyplot as pltfig, ax = plt.subplots(figsize=(8, 5))ax.plot(monthly["month"], monthly["lg_woba"], marker="o", linewidth=2.5, color="#2c3e50")ax.set_ylabel("wOBA")ax.set_title("League wOBA by Month, 2026")ax.spines[["top", "right"]].set_visible(False)plt.tight_layout()plt.show()
Figure 1: League-wide wOBA by month, the headline number behind the table above
The shape of the season is right there at a glance: a climb from March into June, then two months easing back down. Everything below is about what’s actually driving that second half of the curve.
August is a partial month so far, but it’s a real sample: 124 games as of this writing, more than a third of a full month’s slate. Fastball velocity has stayed essentially flat all season (94.3 to 94.7 mph, no real trend either way), so nothing below is explained by pitchers suddenly throwing softer.
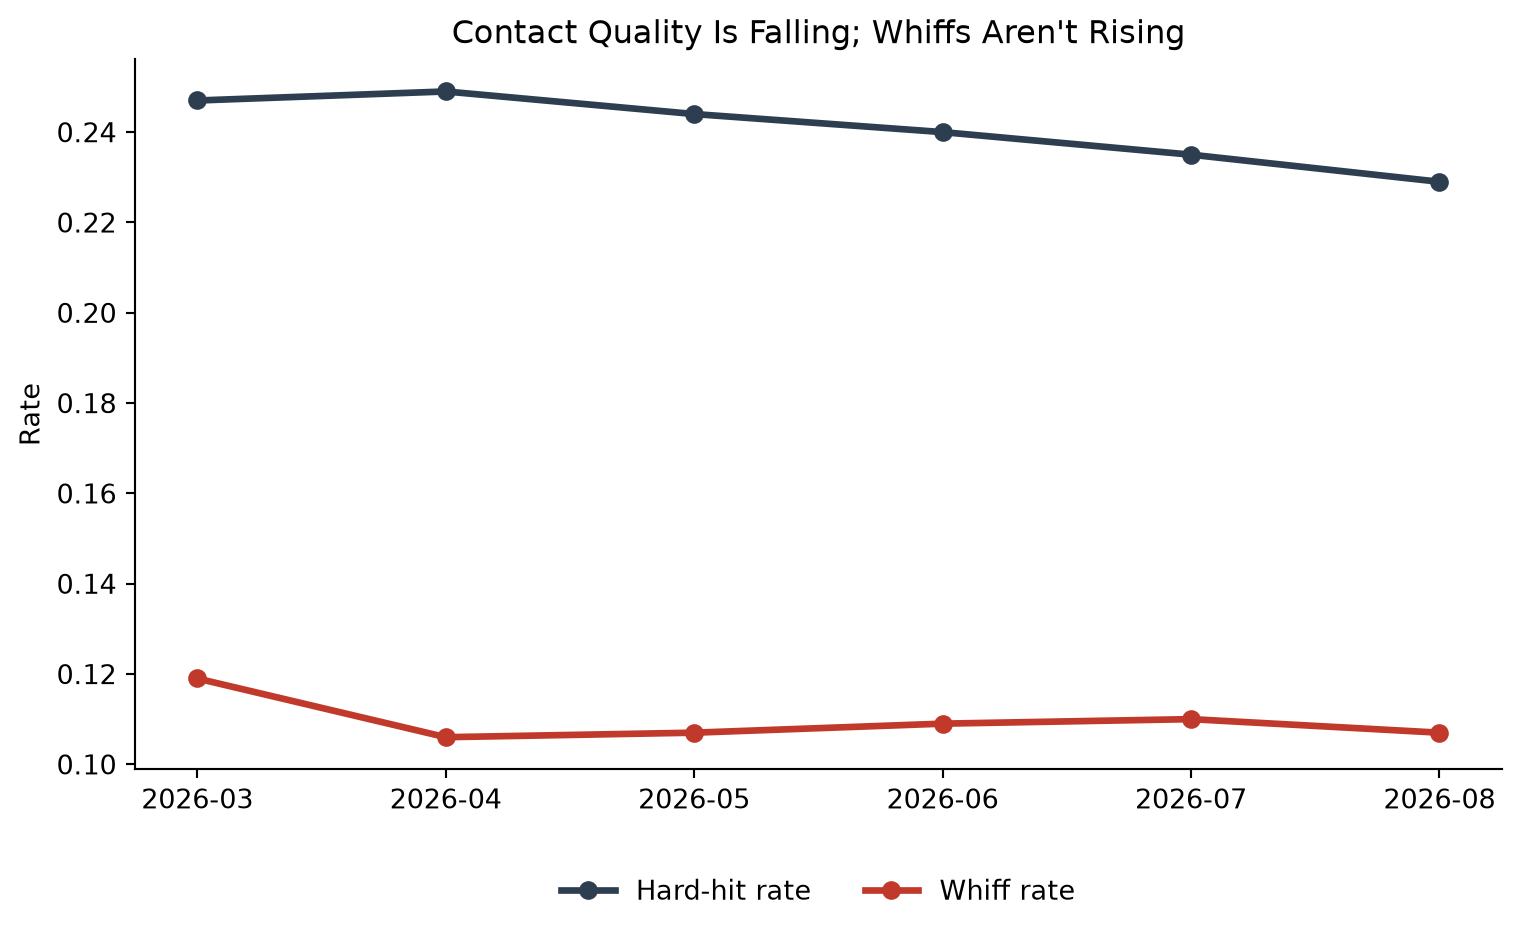
Hard-hit rate (batted balls at 95 mph or above) peaked in April at .249 and has fallen every single month since: .244 in May, .240 in June, .235 in July, .229 in August, its lowest point of the season and four straight months of decline. Average exit velocity tells a similar story on a smaller scale, peaking in May at 82.77 mph and drifting down to 82.35 by August.
Whiff rate is the piece that rules out the obvious explanation. If hitters were simply missing the ball more often, that alone could explain weaker results without any real change in the quality of their contact. That’s not what’s happening here: whiff rate has sat in a narrow .106 to .110 band every month since April, no trend in either direction. Hitters are making contact just as often as they were in the spring. They’re just not hitting it as hard when they do.
Home runs and wOBA didn’t cool off until a month later
fig, ax = plt.subplots(figsize=(8, 5))ax.bar(monthly["month"], monthly["hr_rate"], color="#2c3e50")ax.set_xlabel("Month")ax.set_ylabel("Home runs per plate appearance")ax.set_title("League HR Rate by Month, 2026")ax.spines[["top", "right"]].set_visible(False)plt.tight_layout()plt.show()
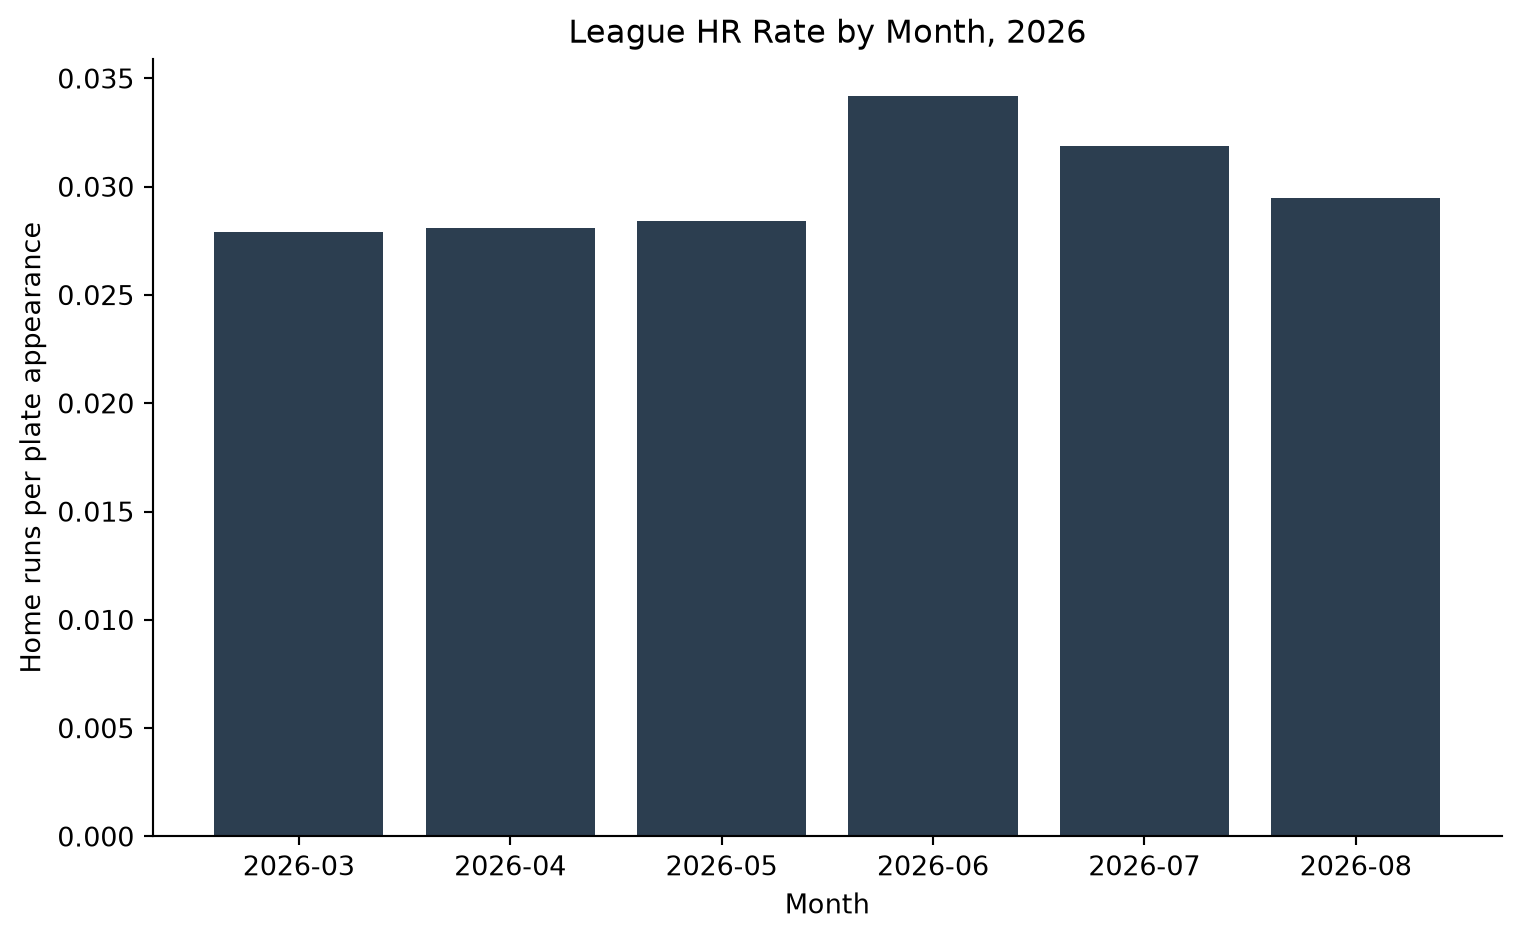
Figure 3: League-wide home run rate per plate appearance, by month
Here’s the part that doesn’t fit a simple story. Hard-hit rate was already declining in May, but home run rate and wOBA kept climbing through June (.0342 HR rate, .334 wOBA, both season highs) before turning down in July and again in August (.0295 and .323). For about two months, production kept rising even as the underlying contact quality behind it was already softening. Warmer air carrying more fly balls out, the explanation our first-half post offered for the spring climb, could plausibly cover that gap for a while: a ball hit a little softer can still leave the park in July heat if it wouldn’t have in April. By August, whatever cushion that provided evidently wasn’t enough to offset four months of declining hard-hit rate, and production caught down to where contact quality already was.
That’s a hypothesis this data can’t fully confirm since we don’t have a clean way to isolate weather’s effect pitch by pitch, but it fits the timeline better than assuming contact quality and production should move together in lockstep every month.
What this doesn’t say
This is four and a half months of one season, not a multi-year signal, and August is still filling in: the 124 games behind this month’s row in the table above will grow into a full slate over the next few weeks, and that number could move. I’ll post a follow-up piece once August completes.
Note
This post uses Quarto’s frozen execution (freeze: auto): the numbers above reflect mlb_statcast.pitches as of whenever this was last rendered locally, not a live query on every page load. August figures in particular will look different on a re-render as the month fills in.