The Contact Quality Decline Held Up Through a Full August
Baseball
Now that August is complete, a follow-up on hard-hit rate’s five-month decline, a still-flat whiff rate, and where home run rate and wOBA landed after their June peak.
Published
September 3, 2026
Our last post flagged a real trend on a partial August: hard-hit rate falling for four straight months, whiff rate holding flat, and home run rate and wOBA both cooling off two months after peaking in June. We closed by saying we’d check back once the month was actually finished. It is now, and the trend held.
The season, six complete months
from google.cloud import bigqueryclient = bigquery.Client()monthly_query ="""SELECT FORMAT_DATE('%Y-%m', CAST(game_date AS DATE)) AS month, COUNT(DISTINCT game_pk) AS games, ROUND(SAFE_DIVIDE(SUM(woba_value), SUM(woba_denom)), 3) AS lg_woba, ROUND(SAFE_DIVIDE(COUNTIF(events = 'strikeout'), COUNTIF(events IS NOT NULL)), 3) AS k_rate, ROUND(SAFE_DIVIDE(COUNTIF(events = 'walk'), COUNTIF(events IS NOT NULL)), 3) AS bb_rate, ROUND(SAFE_DIVIDE(COUNTIF(events = 'home_run'), COUNTIF(events IS NOT NULL)), 4) AS hr_rate, ROUND(SAFE_DIVIDE(COUNTIF(description IN ('swinging_strike', 'swinging_strike_blocked')), COUNTIF(description IS NOT NULL)), 3) AS whiff_rate, ROUND(AVG(launch_speed), 2) AS avg_exit_velo, ROUND(SAFE_DIVIDE(COUNTIF(launch_speed >= 95), COUNTIF(launch_speed IS NOT NULL)), 3) AS hard_hit_rate, ROUND(AVG(IF(pitch_type IN ('FF', 'SI'), release_speed, NULL)), 2) AS avg_fastball_veloFROM `maydaystats.mlb_statcast.pitches`WHERE game_type = 'R' AND CAST(game_date AS DATE) < '2026-09-01'GROUP BY monthORDER BY month"""monthly = client.query(monthly_query).to_dataframe()monthly_tbl = monthly.reset_index(drop=True)monthly_tbl.index +=1monthly_tbl
month
games
lg_woba
k_rate
bb_rate
hr_rate
whiff_rate
avg_exit_velo
hard_hit_rate
avg_fastball_velo
1
2026-03
76
0.317
0.244
0.095
0.0279
0.119
82.67
0.247
94.49
2
2026-04
392
0.328
0.216
0.092
0.0281
0.106
82.67
0.249
94.29
3
2026-05
419
0.320
0.218
0.085
0.0284
0.107
82.77
0.244
94.50
4
2026-06
394
0.334
0.222
0.083
0.0342
0.109
82.51
0.240
94.69
5
2026-07
371
0.327
0.222
0.082
0.0319
0.110
82.47
0.235
94.64
6
2026-08
417
0.323
0.217
0.086
0.0289
0.106
82.31
0.231
94.59
September has already started, but this post deliberately stops at August 31. A handful of September games would add more noise than signal to a monthly view, so it’s better to close the book on a complete month than tack on a partial one.
import matplotlib.pyplot as pltfig, ax = plt.subplots(figsize=(8, 5))ax.plot(monthly["month"], monthly["lg_woba"], marker="o", linewidth=2.5, color="#2c3e50")ax.set_ylabel("wOBA")ax.set_title("League wOBA by Month, 2026")ax.spines[["top", "right"]].set_visible(False)plt.tight_layout()plt.show()
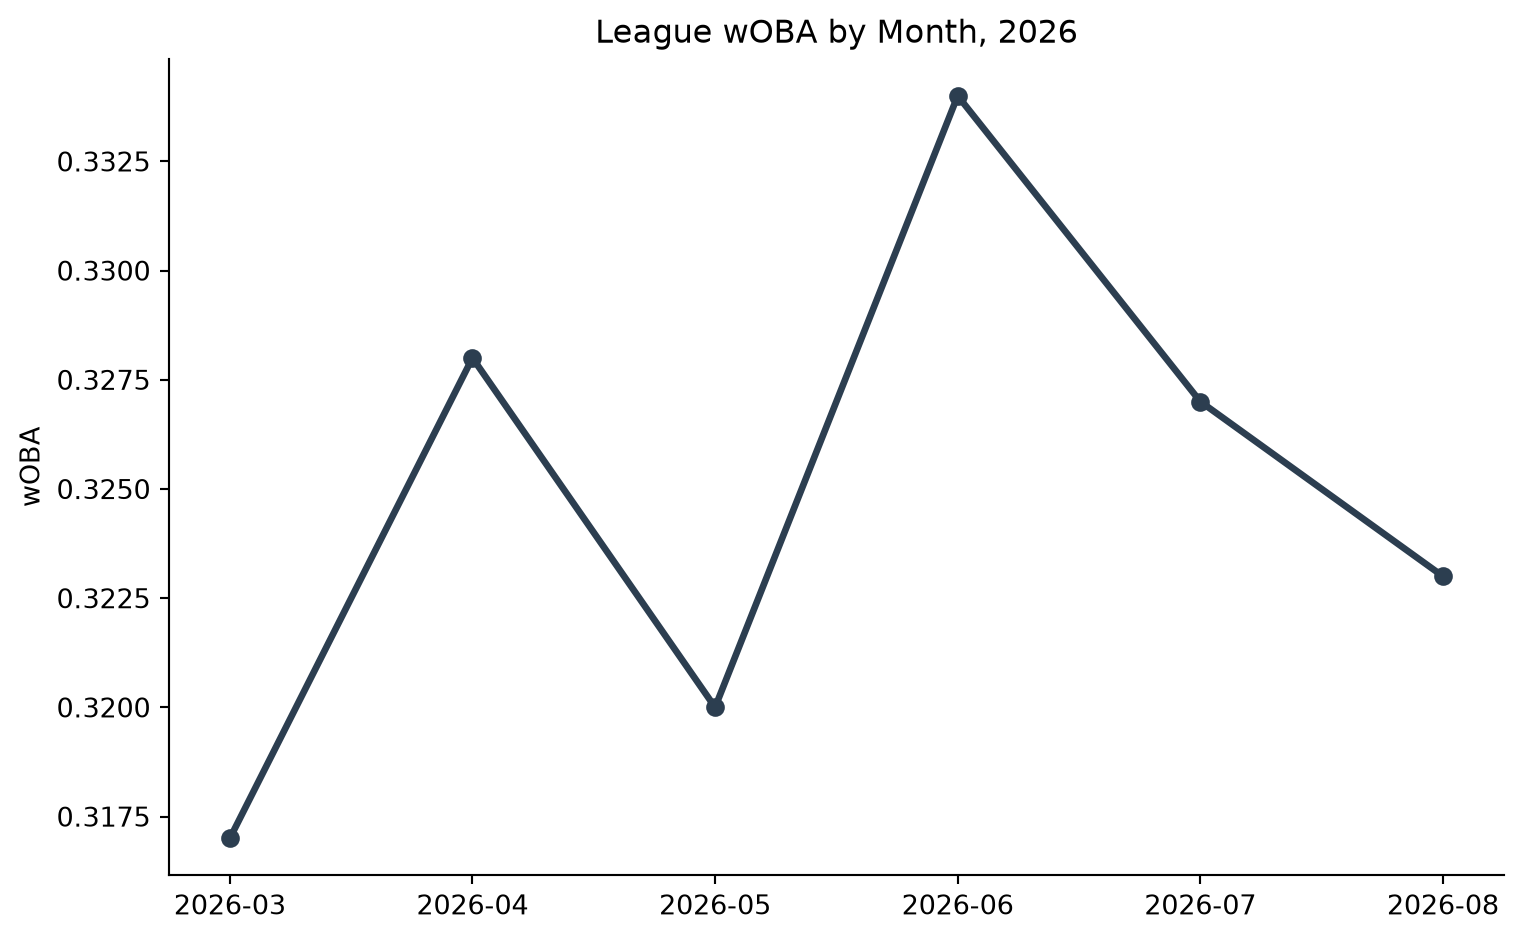
Figure 1: League-wide wOBA by month, six complete months
wOBA closed August at .323, its second straight month down from June’s .334 peak but still above where the season opened in March (.317). The climb-then-cool shape from the last post held up exactly as it looked on the partial data.
Hard-hit rate: five months down, not four
fig, ax = plt.subplots(figsize=(8, 5))ax.plot(monthly["month"], monthly["hard_hit_rate"], marker="o", linewidth=2.5, color="#2c3e50", label="Hard-hit rate")ax.plot(monthly["month"], monthly["whiff_rate"], marker="o", linewidth=2.5, color="#c0392b", label="Whiff rate")ax.set_ylabel("Rate")ax.set_title("Contact Quality Is Still Falling; Whiffs Still Aren't")ax.spines[["top", "right"]].set_visible(False)ax.legend(loc="upper center", bbox_to_anchor=(0.5, -0.12), ncol=2, frameon=False)plt.tight_layout()plt.show()
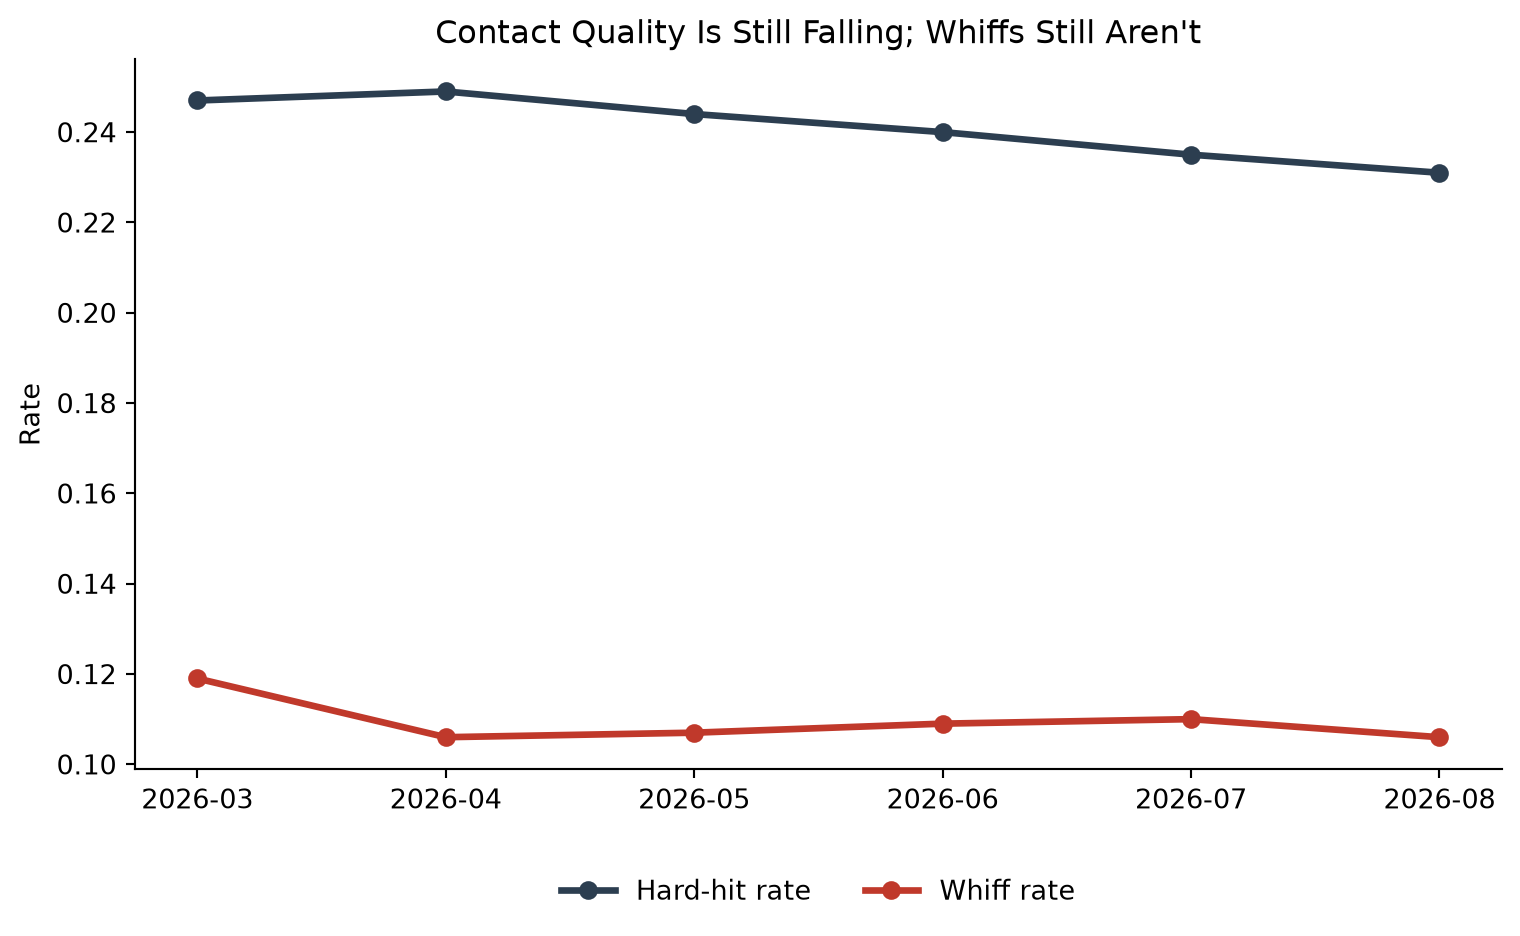
Figure 2: Hard-hit rate vs. whiff rate, by month
The partial August read in the last post had hard-hit rate at .229 across 124 games. The completed month landed at .231. A full slate of 417 games told almost exactly the same story as the smaller sample did. That makes five straight months of decline from April’s .249 peak: .244 in May, .240 in June, .235 in July, and .231 in August. Every month since April has come in lower than the one before it. Average exit velocity shows the same pattern: it fell from May’s 82.77 mph peak to 82.31 in August, the lowest point of the year.
Whiff rate is exactly where it’s been all season: .106 in August, inside the same .106 to .110 band it’s held since April. After five months of softer contact, hitters still aren’t missing the ball any more often than they were in the spring. Whatever’s driving this isn’t strikeouts.
Home runs and wOBA: three months down from the June peak
fig, ax = plt.subplots(figsize=(8, 5))ax.bar(monthly["month"], monthly["hr_rate"], color="#2c3e50")ax.set_xlabel("Month")ax.set_ylabel("Home runs per plate appearance")ax.set_title("League HR Rate by Month, 2026")ax.spines[["top", "right"]].set_visible(False)plt.tight_layout()plt.show()
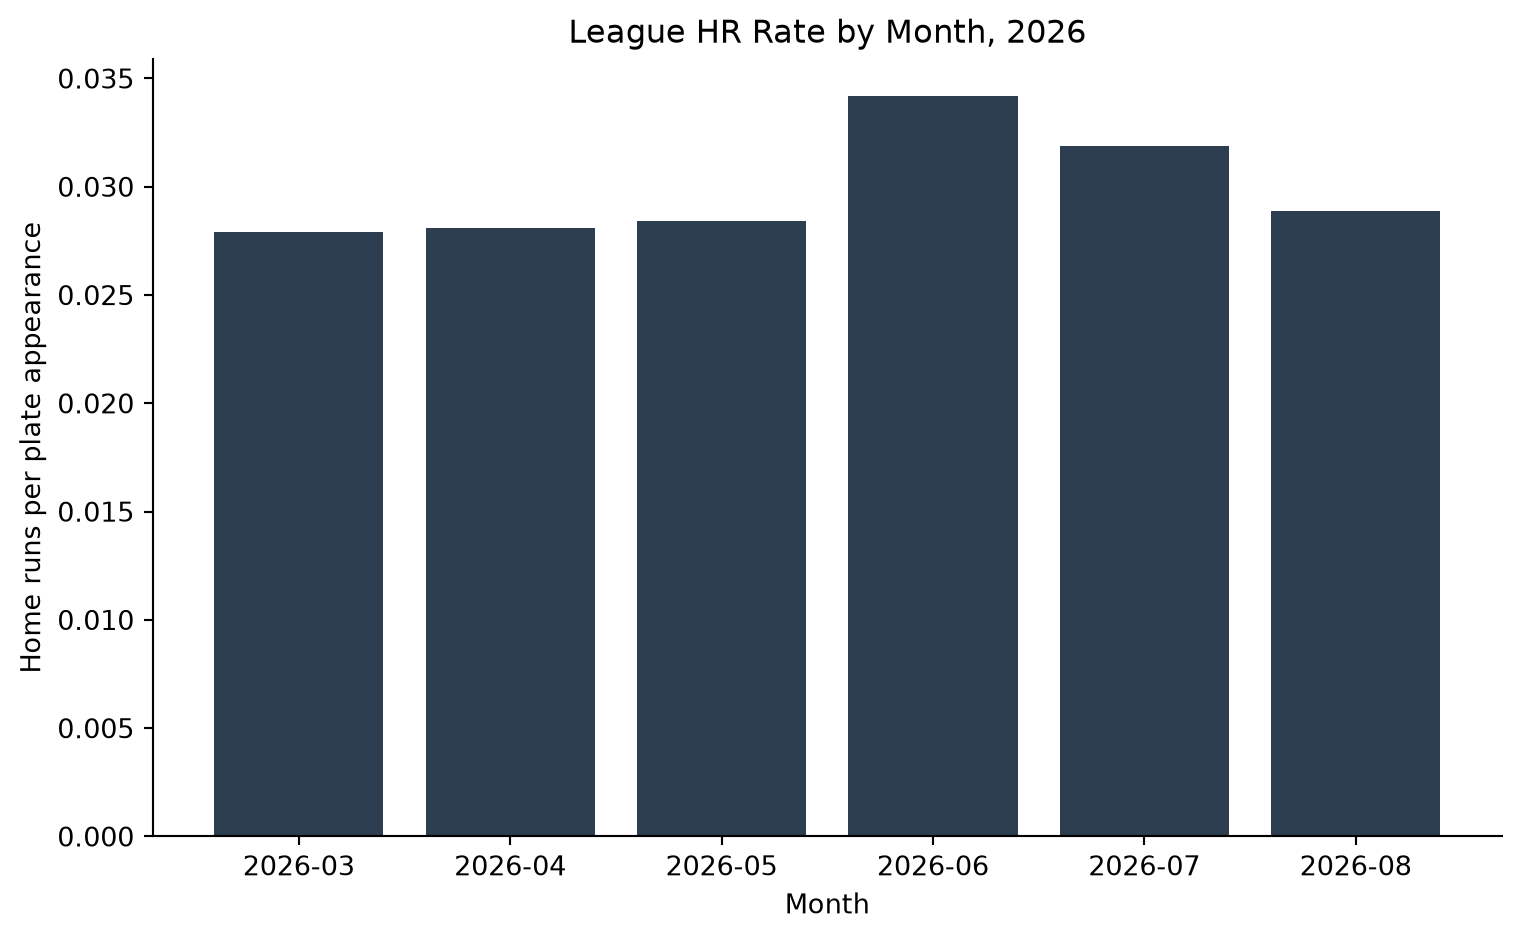
Figure 3: League-wide home run rate per plate appearance, by month
Home run rate peaked in June at .0342 and has fallen every month since, .0319 in July and .0289 in August. That’s essentially back to where it started in April and May (.0281 and .0284). It’s also three straight months of decline following the June high, one more confirmed month than we had last time.
The lag we flagged before still holds up too: hard-hit rate started sliding in May, a full month before home run rate and wOBA turned over in July. Warmer summer air can carry a fly ball a little further, which was our explanation for the spring climb, and that could plausibly explain why production kept rising for a while even as contact quality was already softening underneath it, before finally catching down in July. That’s a hypothesis, not something this data can confirm outright. But the shape of six complete months fits it better than assuming contact quality and production should always move together.
What this doesn’t say
Five months in one season is a real pattern, not a coin flip, though it’s still a single season rather than a multi-year baseline. Pitching isn’t the explanation either: fastball velocity held essentially flat all year, between 94.3 and 94.7 mph, so this isn’t pitchers throwing softer, and as covered above, it isn’t a strikeout story. What’s actually driving the decline, a real shift in swing decisions, ballpark and weather effects fading as summer turns to fall, or something else entirely, is more than this data alone can answer. It can describe the shape of the trend, not explain the cause behind it. September’s early games will start adding to that picture soon enough.
Note
This post uses Quarto’s frozen execution (freeze: auto): the numbers above reflect mlb_statcast.pitches as of whenever this was last rendered locally, not a live query on every page load. The query is explicitly bounded to games before September 1, so a re-render won’t pull in September data even after more of it exists.